Components / display
StackedBarChart builder
Bars stacked from the same category identity across series.
A builder is RenderOnce. Construct and mount it in one expression.
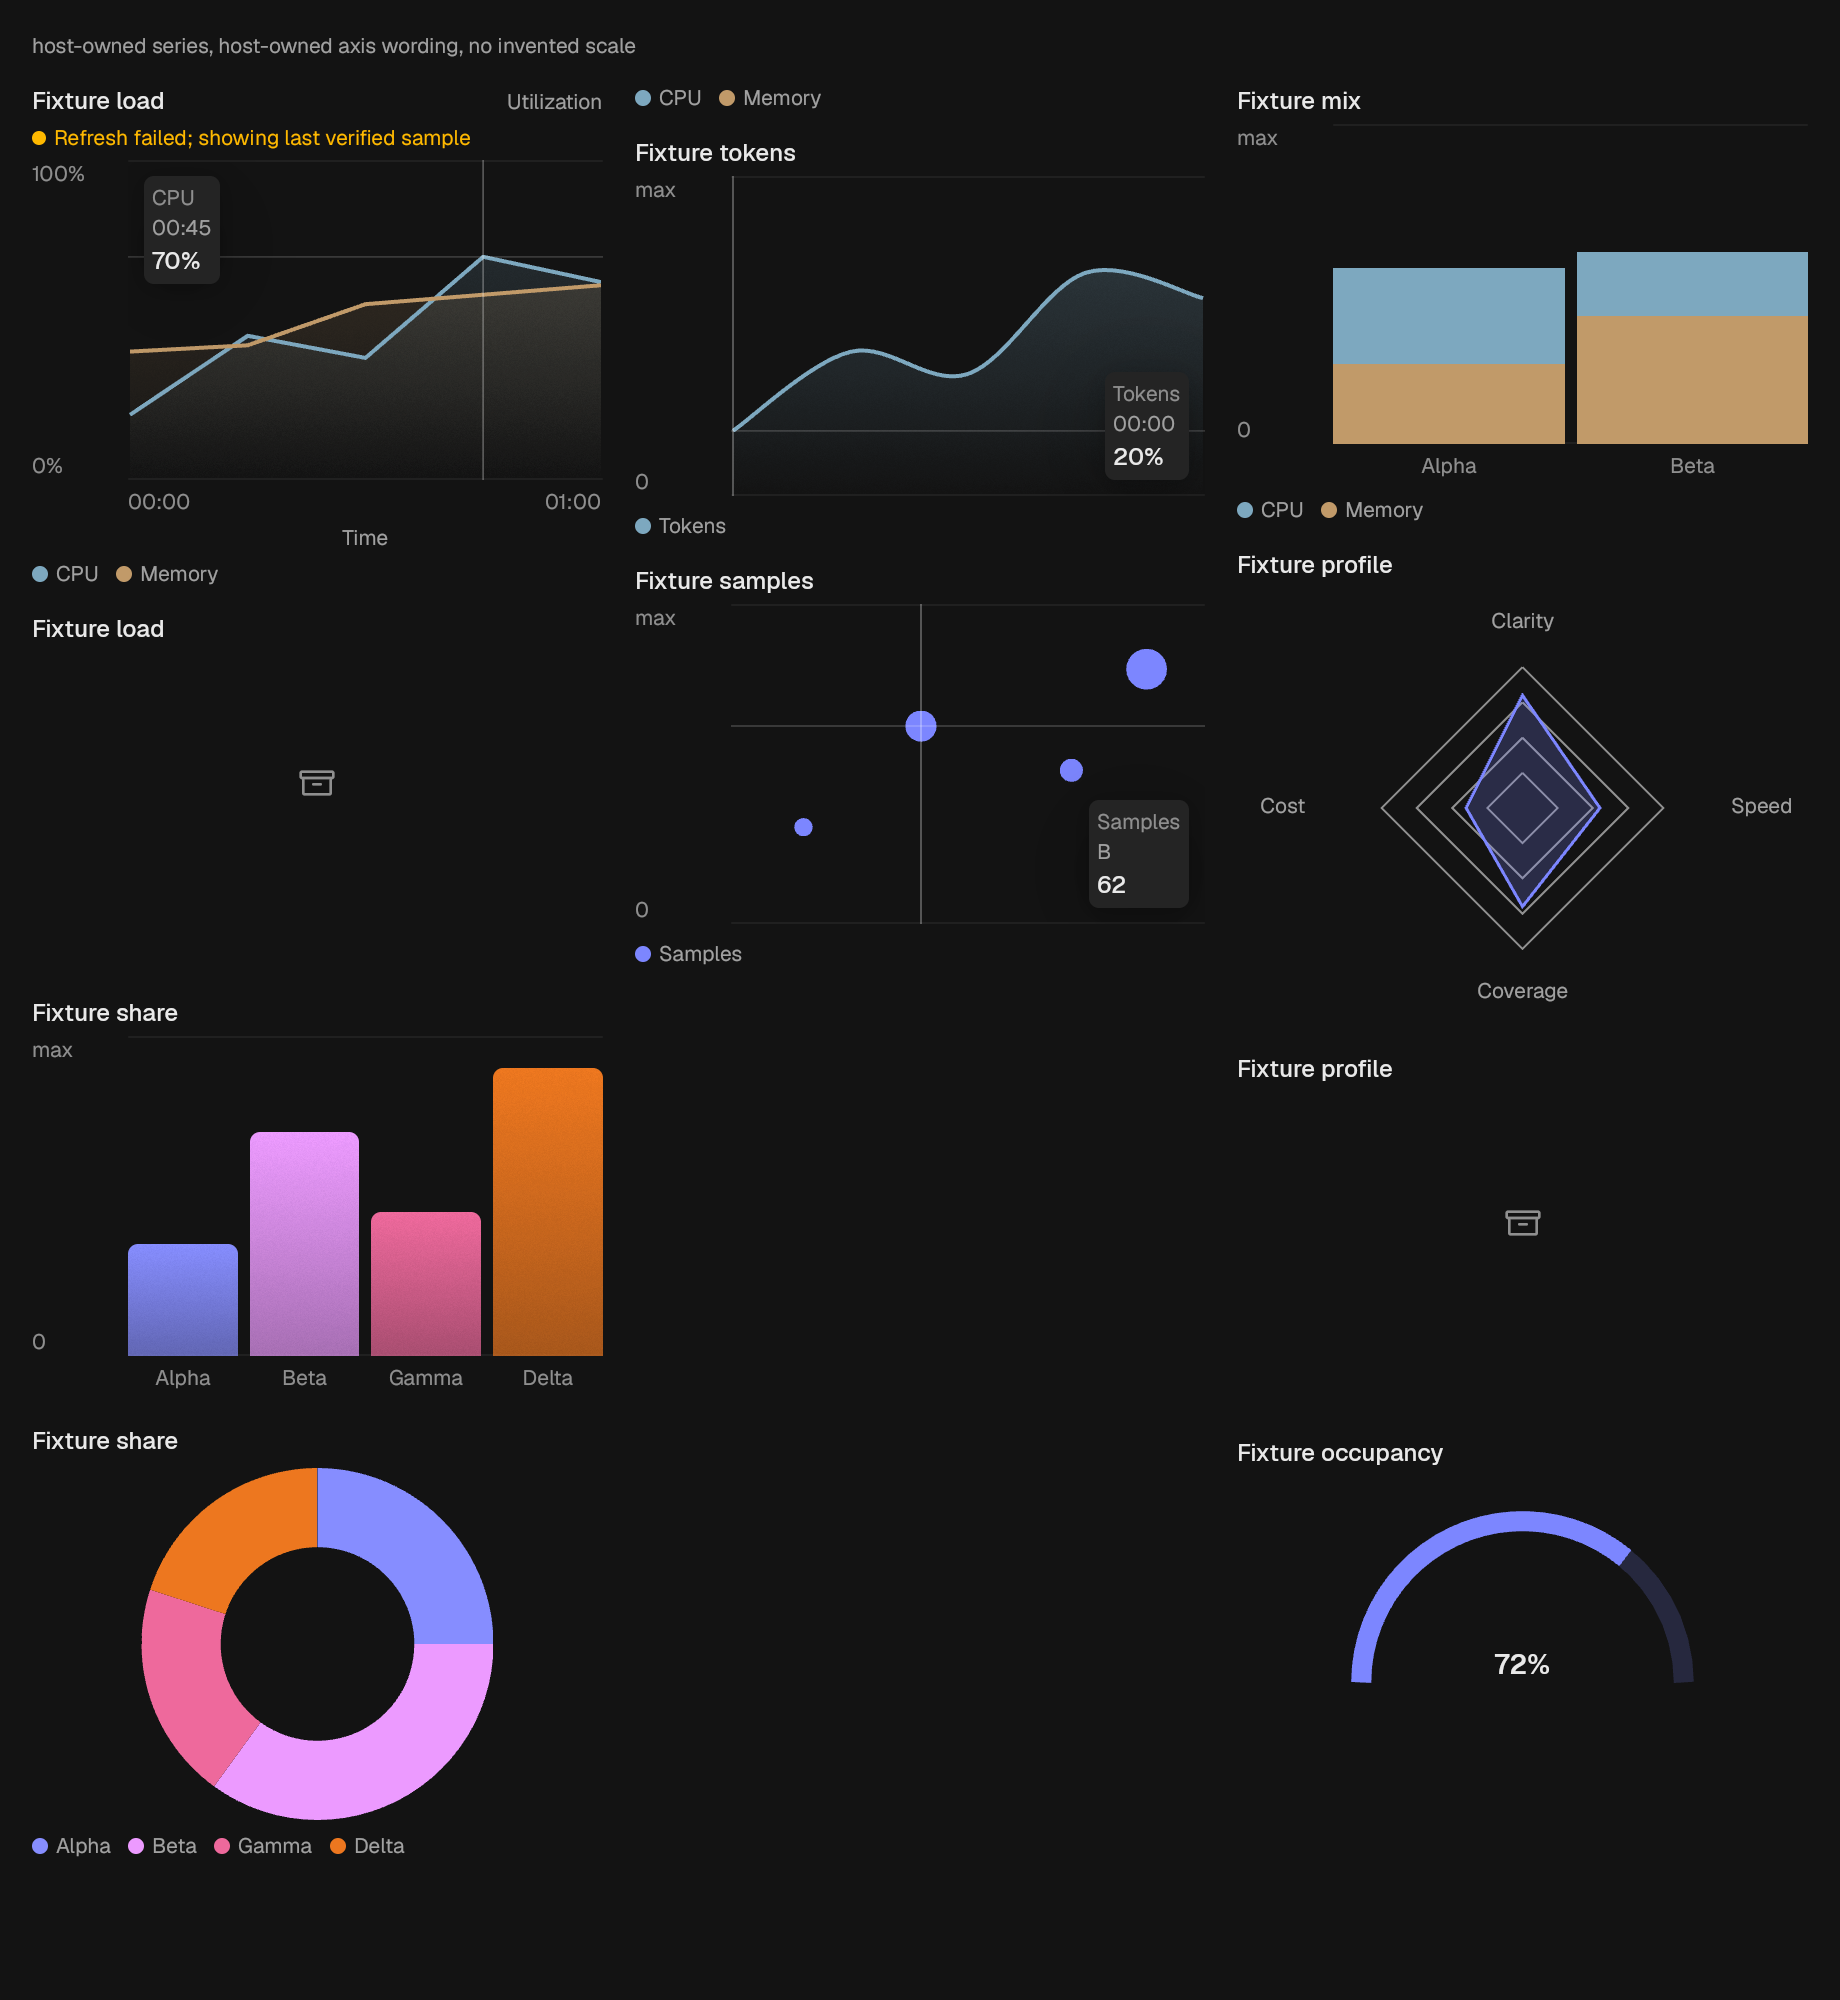
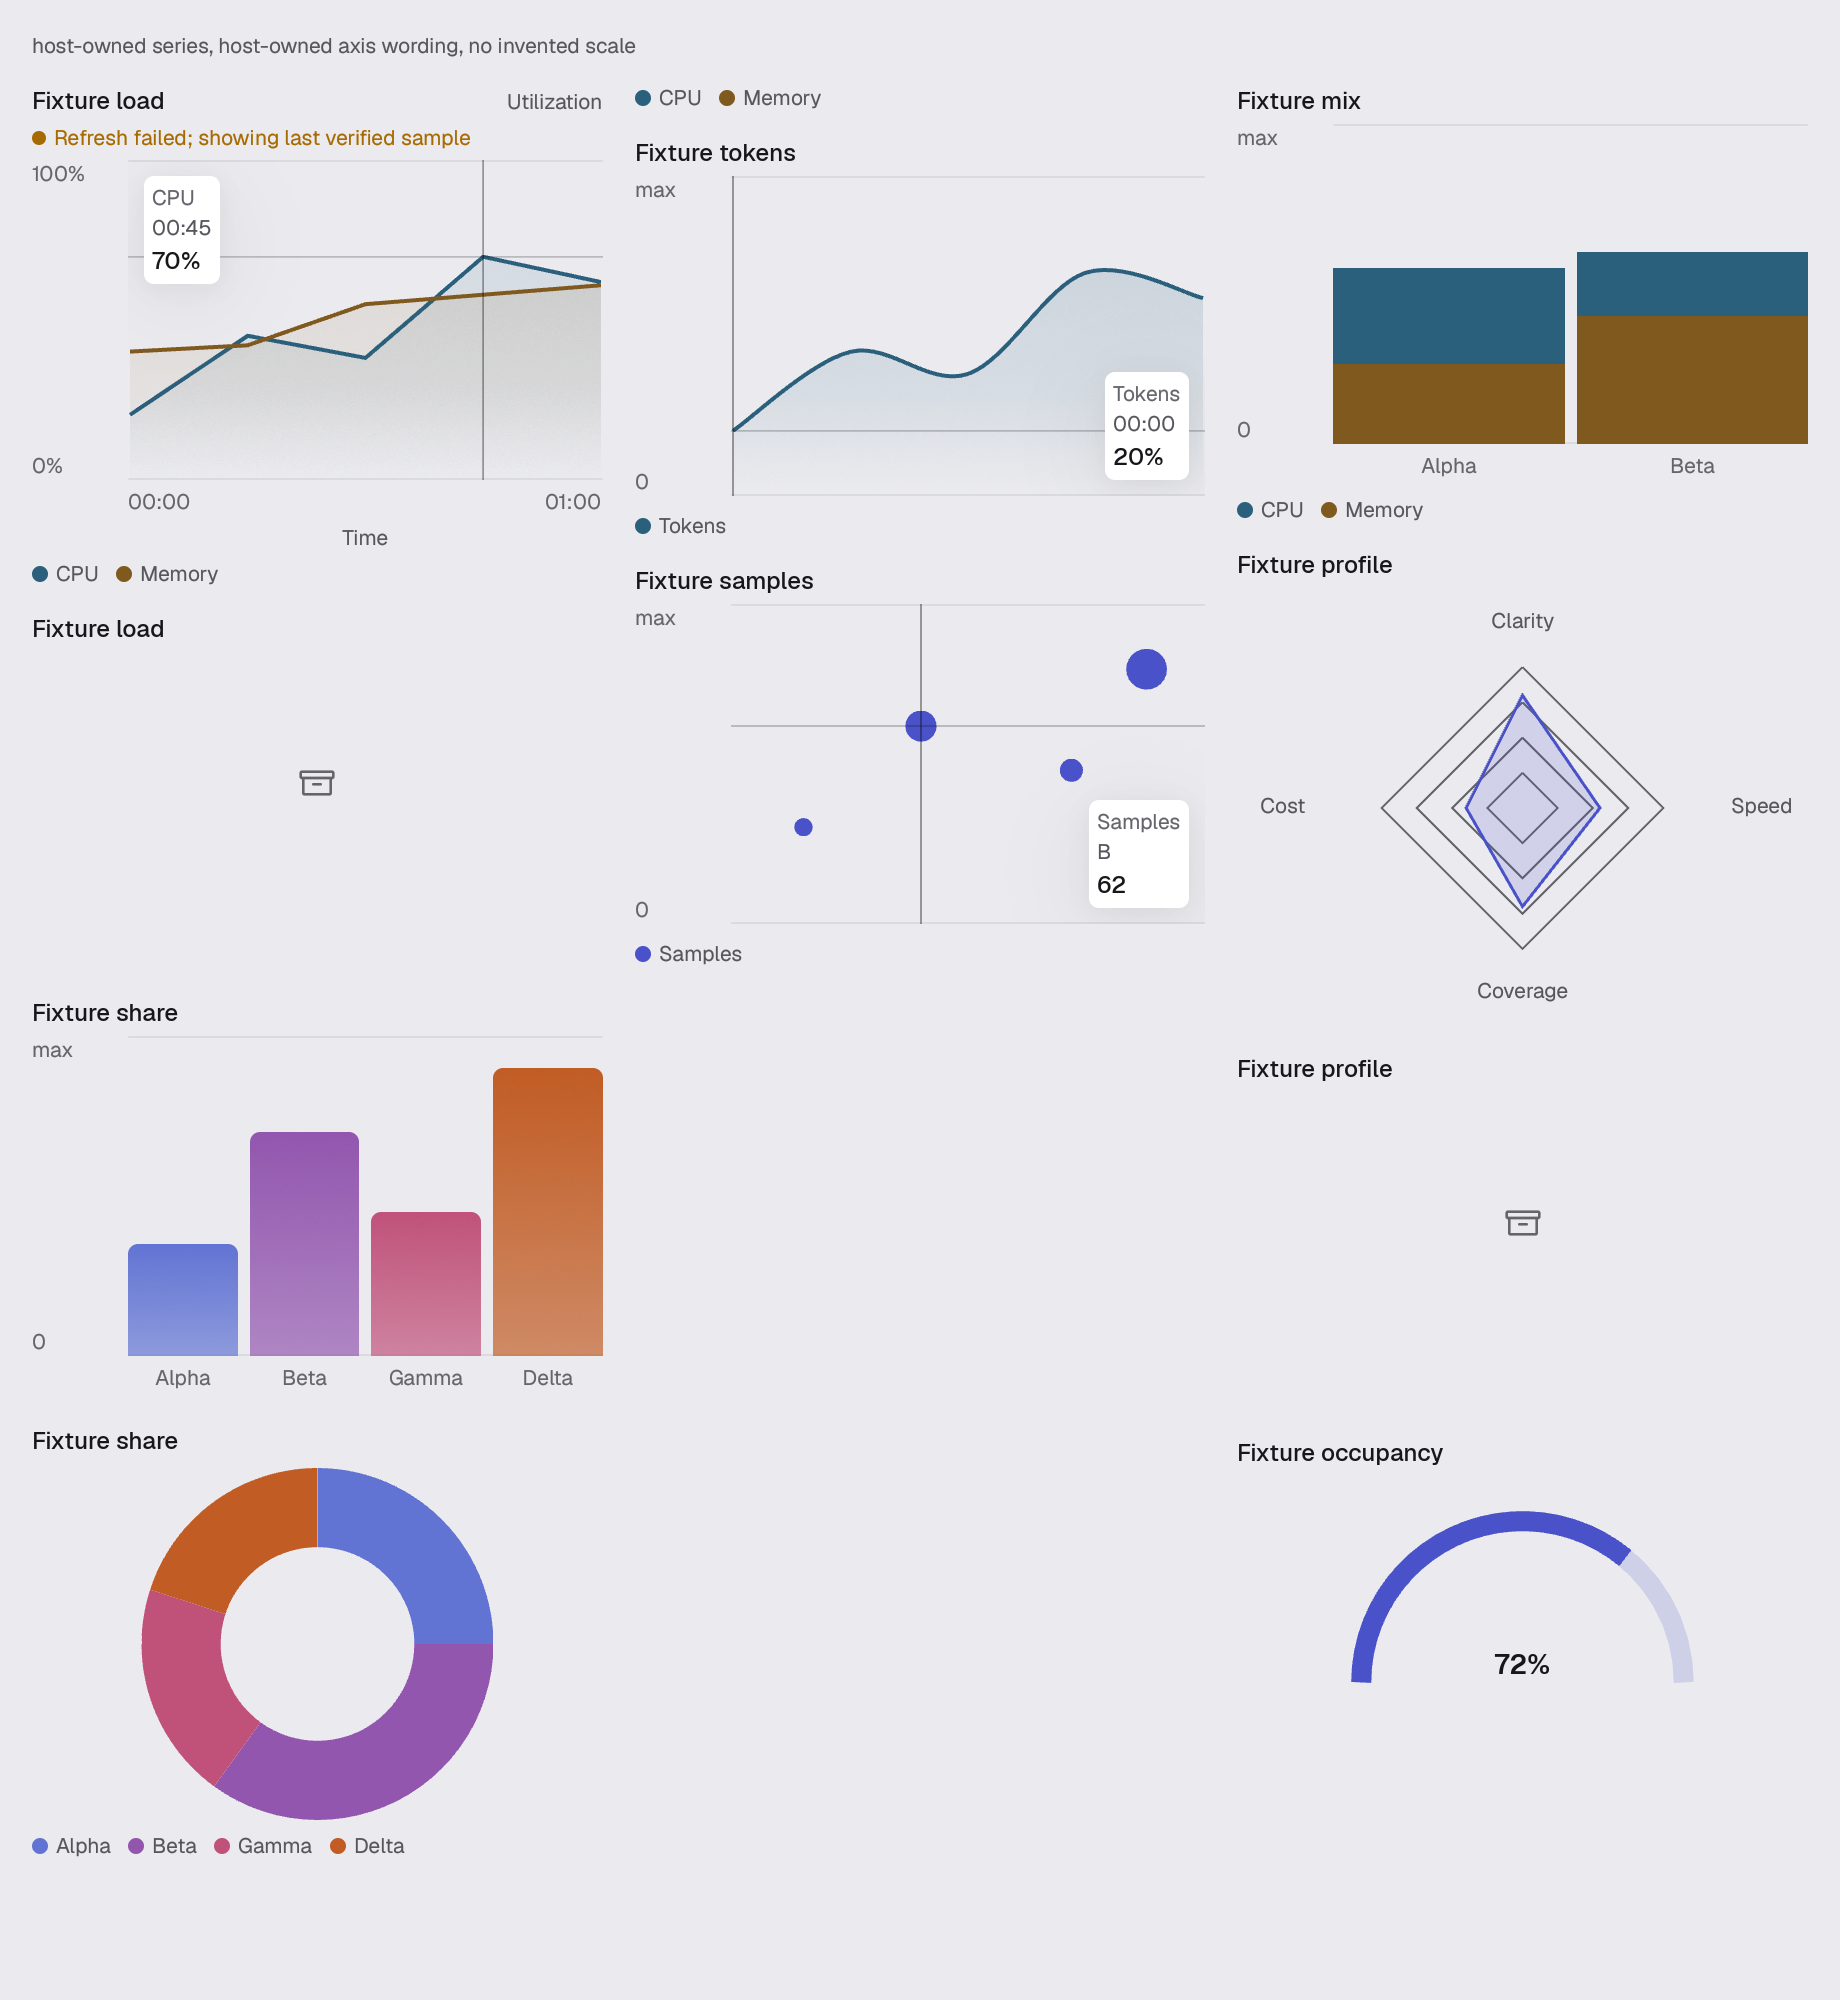
use gpui_kit::display::chart::StackedBarChart;Reviewed in chart.
Construct
new(ident: impl Into<Ident>, label: impl Into<SharedString>, state: ChartState) -> SelfOptions
Chain onto the value.
axes(axes: ChartAxes) -> SelfExample · chart
fn chart(_window: &mut Window, cx: &mut App) -> AnyElement {
let theme = cx.theme().clone();
let cpu = [
ChartPoint::new("00:00", 0.0, 0.20, "00:00", "20%"),
ChartPoint::new("00:15", 0.25, 0.45, "00:15", "45%"),
ChartPoint::new("00:30", 0.5, 0.38, "00:30", "38%"),
ChartPoint::new("00:45", 0.75, 0.70, "00:45", "70%"),
ChartPoint::new("01:00", 1.0, 0.62, "01:00", "62%"),
];
let memory = [
ChartPoint::new("00:00", 0.0, 0.40, "00:00", "40%"),
ChartPoint::new("00:15", 0.25, 0.42, "00:15", "42%"),
ChartPoint::new("00:30", 0.5, 0.55, "00:30", "55%"),
ChartPoint::new("00:45", 0.75, 0.58, "00:45", "58%"),
ChartPoint::new("01:00", 1.0, 0.61, "01:00", "61%"),
];
// Three columns rather than one tall stack. The family is eleven surfaces
// once truthful empty/stale states are included, and even two columns run
// the final plots below the fixed review frame.
let column = || {
div()
.column()
.flex_1()
.min_w_0()
.gap(px(theme.space(Space::Md)))
};
// The frame this is reviewed in is 920 wide. Every column flexes inside
// that width so the third one earns vertical room without escaping at the
// right edge.
stack(&theme)
.w(px(920.0))
.child(caption(
&theme,
"host-owned series, host-owned axis wording, no invented scale",
))
.child(
div()
.row()
.items_start()
.w_full()
.gap(px(theme.space(Space::Lg)))
.child(
column()
.child(
LineChart::new(
"scene.chart.ready",
"Fixture load",
ChartState::Stale {
series: vec![
ChartSeries::new("cpu", "CPU")
.points(cpu)
.tint(identity_tint(&theme, "agent.read")),
ChartSeries::new("memory", "Memory")
.points(memory)
.tint(identity_tint(&theme, "agent.shell")),
],
reason: "Refresh failed; showing last verified sample".into(),
},
)
.area()
.crosshair()
.current("cpu", "00:45")
.on_current(|_, _, _| {})
.axes(
ChartAxes::default()
.x_label("Time")
.y_label("Utilization")
.x_ends("00:00", "01:00")
.y_ends("0%", "100%"),
),
)
.child(LineChart::new(
"scene.chart.empty",
"Fixture load",
ChartState::Empty,
))
.child(
BarChart::new(
"scene.chart.bars",
"Fixture share",
ChartState::Ready(vec![ChartSeries::new("share", "Share").points(
[
ChartPoint::new("alpha", 0.0, 0.35, "Alpha", "35 jobs"),
ChartPoint::new("beta", 0.33, 0.70, "Beta", "70 jobs"),
ChartPoint::new("gamma", 0.66, 0.45, "Gamma", "45 jobs"),
ChartPoint::new("delta", 1.0, 0.90, "Delta", "90 jobs"),
],
)]),
)
.axes(ChartAxes::default().y_ends("0", "max")),
)
.child(
PieChart::new(
"scene.chart.pie",
"Fixture share",
ChartState::Ready(vec![ChartSeries::new("share", "Share").points(
[
ChartPoint::new("alpha", 0.0, 0.25, "Alpha", "25%"),
ChartPoint::new("beta", 0.25, 0.35, "Beta", "35%"),
ChartPoint::new("gamma", 0.60, 0.20, "Gamma", "20%"),
ChartPoint::new("delta", 0.80, 0.20, "Delta", "20%"),
],
)]),
)
.donut(),
),
)
.child(
column()
.child(
ChartLegend::new(
"scene.chart.legend",
[
ChartSeries::new("cpu", "CPU")
.tint(identity_tint(&theme, "agent.read")),
ChartSeries::new("memory", "Memory")
.tint(identity_tint(&theme, "agent.shell")),
],
)
.on_toggle(|_, _, _, _| {}),
)
.child(
AreaChart::new(
"scene.chart.area",
"Fixture tokens",
ChartState::Ready(vec![
ChartSeries::new("tokens", "Tokens")
.points([
ChartPoint::new("00:00", 0.0, 0.20, "00:00", "20%"),
ChartPoint::new("00:15", 0.25, 0.45, "00:15", "45%"),
ChartPoint::new("00:30", 0.5, 0.38, "00:30", "38%"),
ChartPoint::new("00:45", 0.75, 0.70, "00:45", "70%"),
ChartPoint::new("01:00", 1.0, 0.62, "01:00", "62%"),
])
.tint(identity_tint(&theme, "agent.read")),
]),
)
.axes(ChartAxes::default().y_ends("0", "max"))
.crosshair(),
)
.child(
ScatterChart::new(
"scene.chart.scatter",
"Fixture samples",
ChartState::Ready(vec![
ChartSeries::new("samples", "Samples").points([
ChartPoint::new("a", 0.15, 0.30, "A", "30").weight(0.2),
ChartPoint::new("b", 0.40, 0.62, "B", "62").weight(0.6),
ChartPoint::new("c", 0.72, 0.48, "C", "48").weight(0.35),
ChartPoint::new("d", 0.88, 0.80, "D", "80").weight(0.9),
]),
]),
)
.crosshair()
.current("samples", "b")
.on_current(|_, _, _| {})
.axes(ChartAxes::default().y_ends("0", "max")),
),
)
.child(
column()
.child(
StackedBarChart::new(
"scene.chart.stacked",
"Fixture mix",
ChartState::Ready(vec![
ChartSeries::new("cpu", "CPU")
.points([
ChartPoint::new("alpha", 0.0, 0.30, "Alpha", "30%"),
ChartPoint::new("beta", 0.5, 0.20, "Beta", "20%"),
])
.tint(identity_tint(&theme, "agent.read")),
ChartSeries::new("memory", "Memory")
.points([
ChartPoint::new("alpha", 0.0, 0.25, "Alpha", "25%"),
ChartPoint::new("beta", 0.5, 0.40, "Beta", "40%"),
])
.tint(identity_tint(&theme, "agent.shell")),
]),
)
.axes(ChartAxes::default().y_ends("0", "max")),
)
.child(RadarChart::new(
"scene.chart.radar",
"Fixture profile",
ChartState::Ready(vec![ChartSeries::new("profile", "Profile").points(
[
ChartPoint::new("clarity", 0.0, 0.80, "Clarity", "80"),
ChartPoint::new("speed", 0.0, 0.55, "Speed", "55"),
ChartPoint::new("coverage", 0.0, 0.70, "Coverage", "70"),
ChartPoint::new("cost", 0.0, 0.40, "Cost", "40"),
],
)]),
))
.child(RadarChart::new(
"scene.chart.radar-empty",
"Fixture profile",
ChartState::Empty,
))
.child(GaugeChart::new(
"scene.chart.gauge",
"Fixture occupancy",
ChartState::Ready(vec![
ChartSeries::new("occupancy", "Occupancy")
.points([ChartPoint::new("now", 0.0, 0.72, "Now", "72%")]),
]),
)),
),
)
.into_any_element()
}