Components / display
CartesianChart builder
Shared-coordinate line/area/bar/scatter layers over raw f64 observations. Missing samples break paths. All-zero data is ready, not empty. An invalid dataset is an explicit error. Stale data remains visible with its reason.
A builder is RenderOnce. Construct and mount it in one expression.
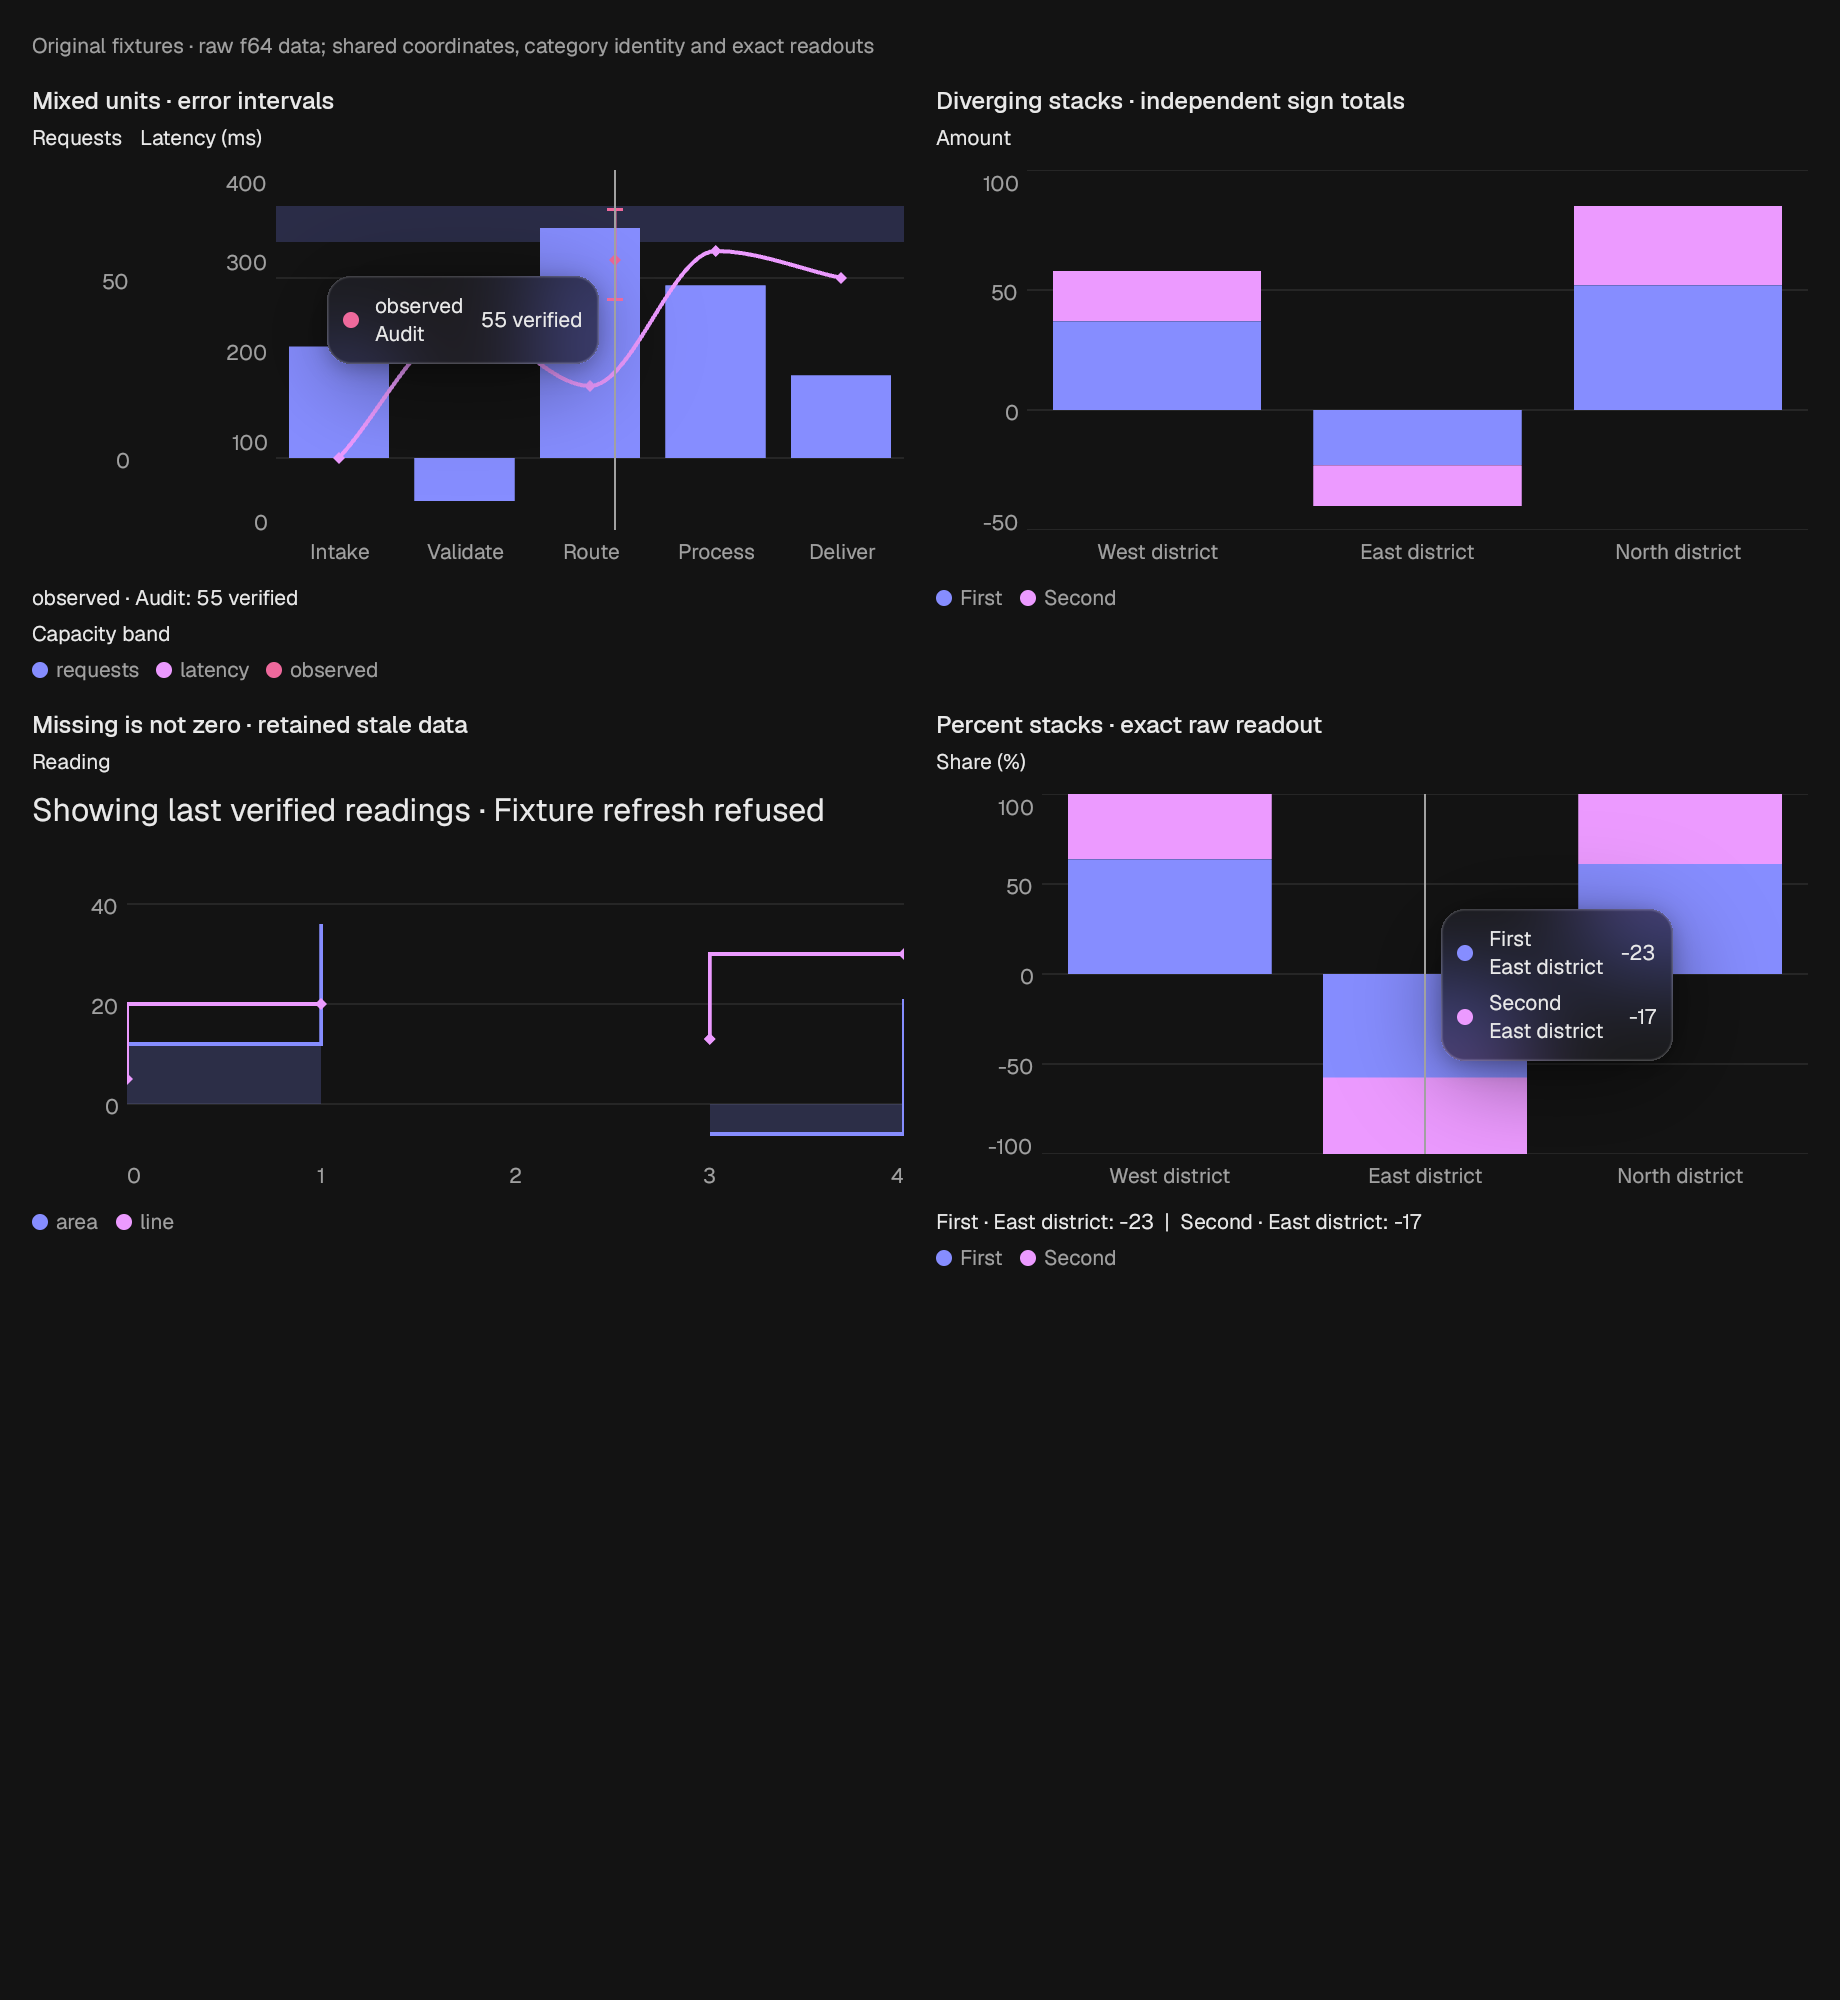
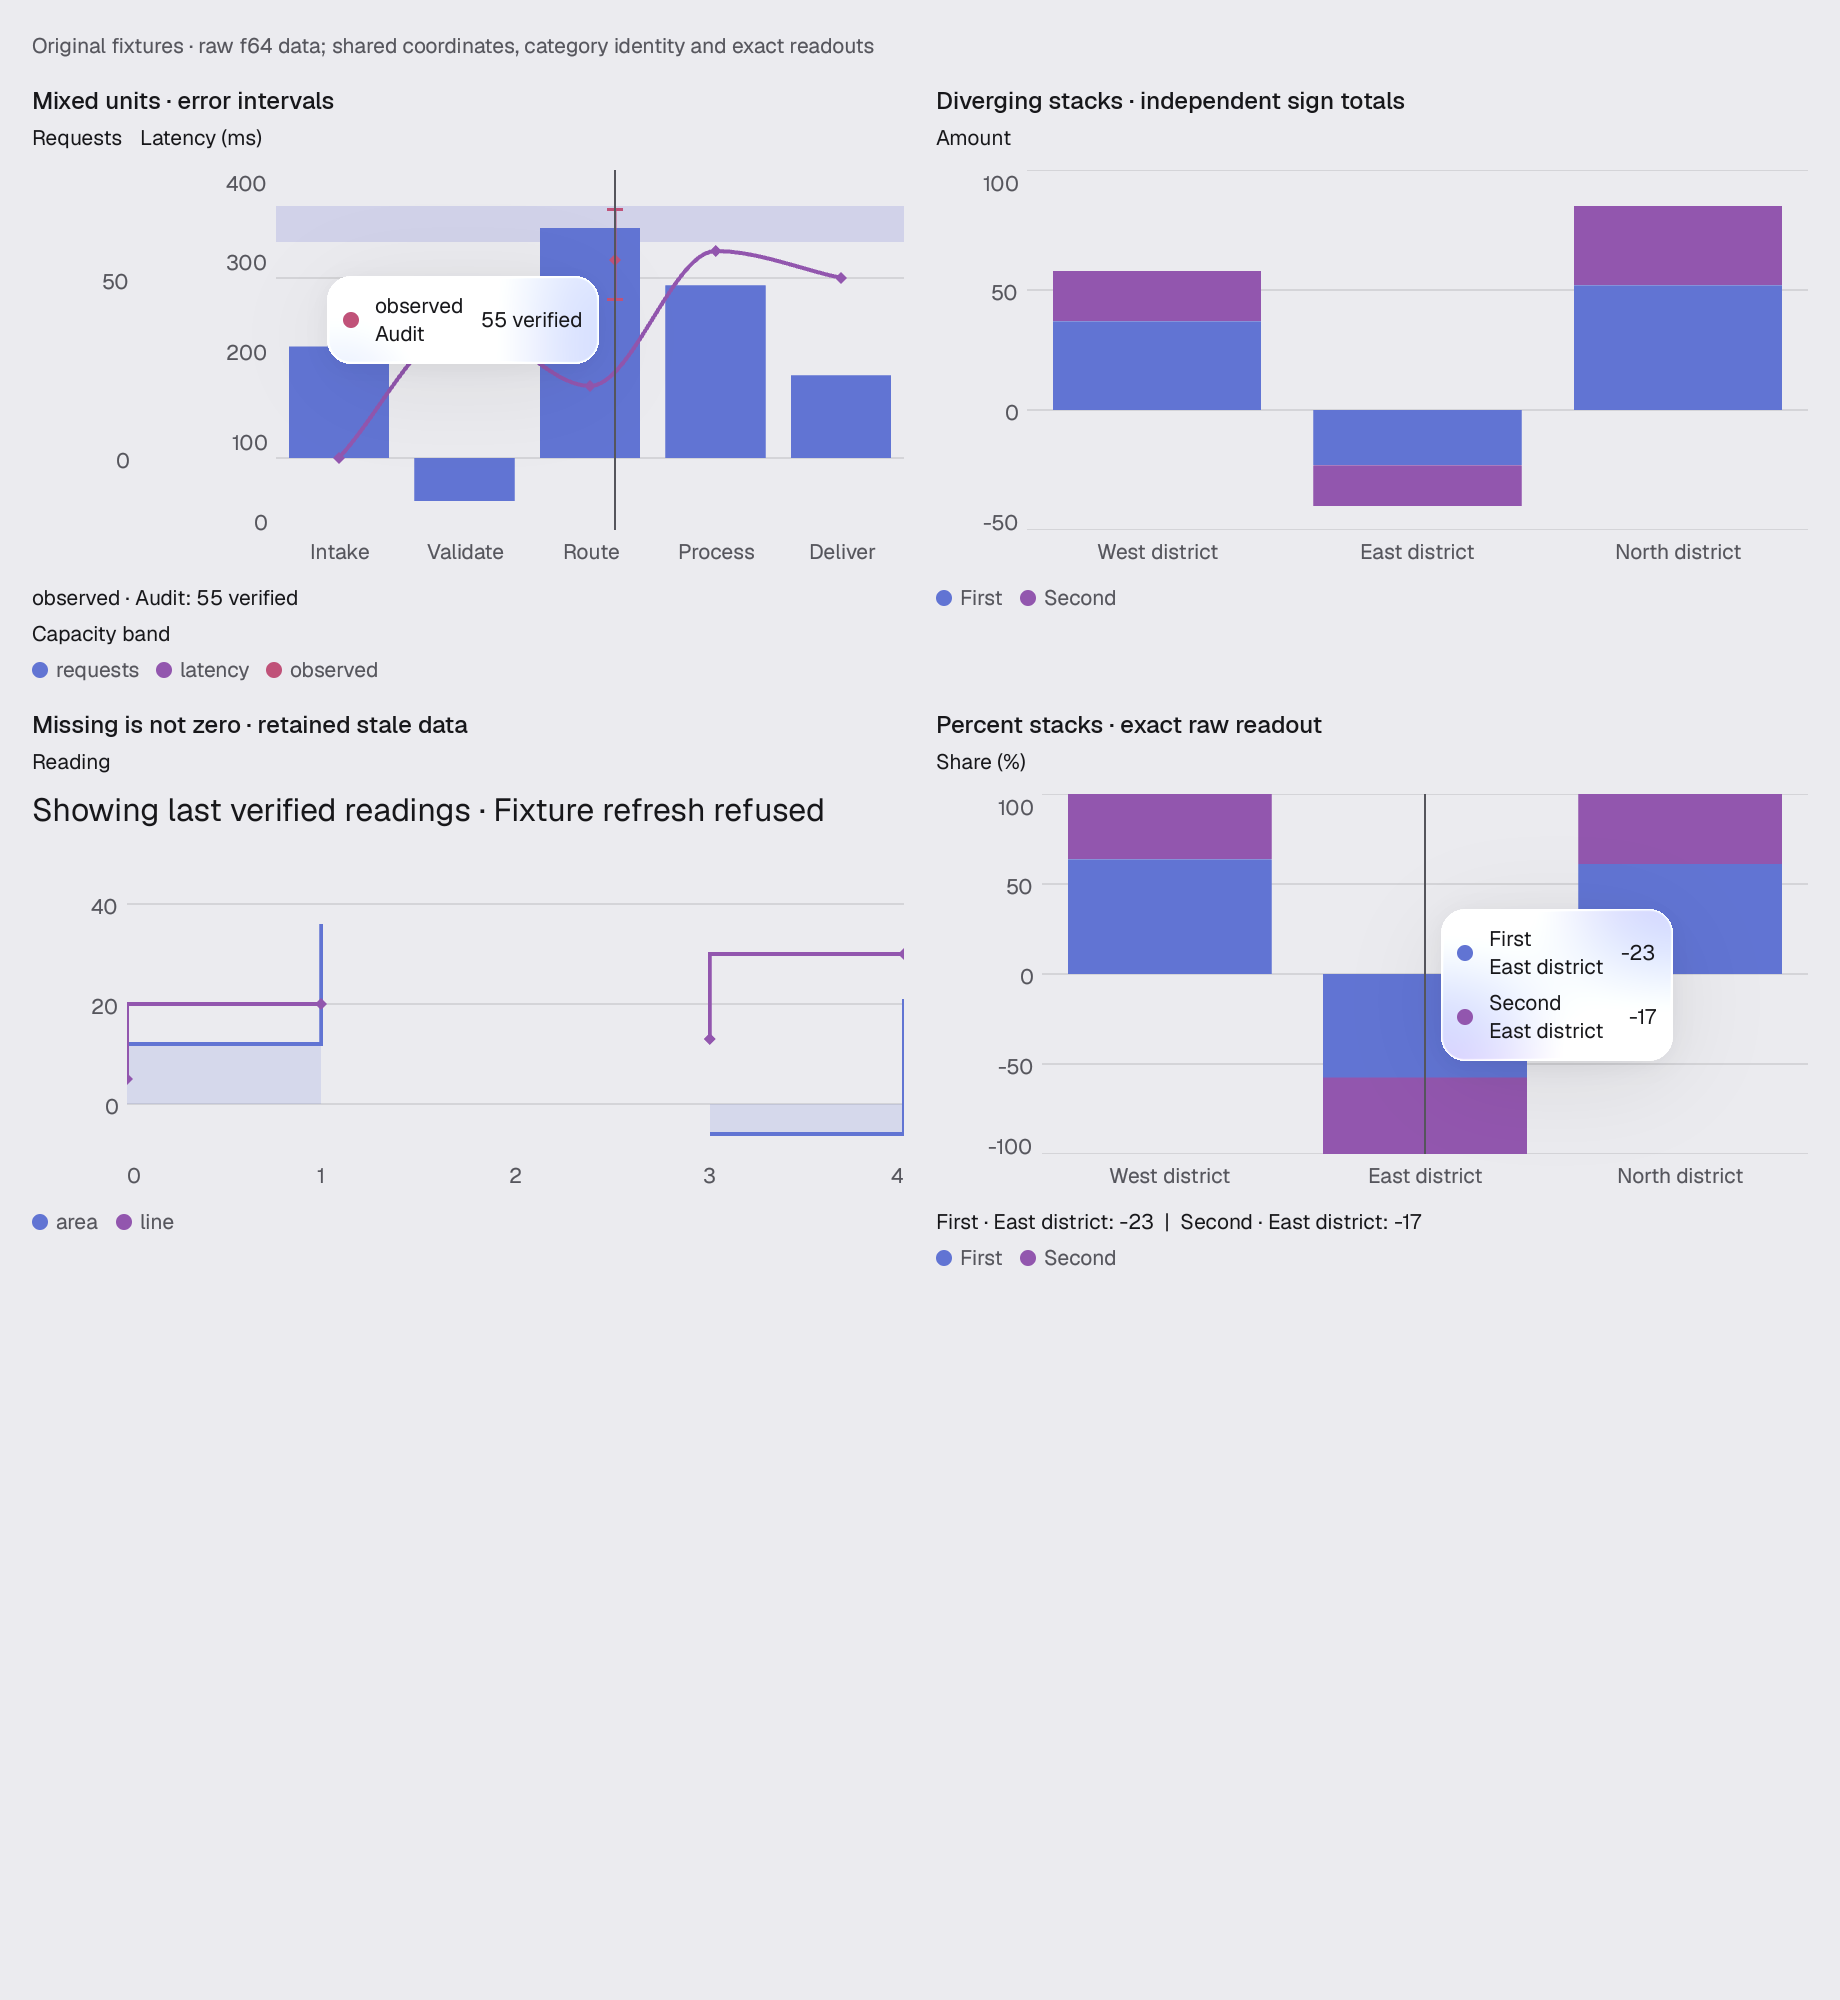
use gpui_kit::display::chart::cartesian::CartesianChart;Reviewed in cartesian cartesian-linked cartesian-layout cartesian-lifecycle cartesian-dense cartesian-states raw-candlestick.
Construct
new(ident: impl Into<Ident>, label: impl Into<SharedString>, x: ChartScale, axes: impl IntoIterator<Item = ValueAxis>) -> SelfOptions
Chain onto the value.
series(series: impl IntoIterator<Item = RawSeries>) -> Self
shared_series(series: Rc<Vec<RawSeries>>) -> Self
animate(enabled: bool) -> Self
motion(motion: CartesianMotion) -> Self
sampling(sampling: PathSampling) -> Self
custom_marks(build: impl Fn(&RawSeries, &RawPoint) -> Option<CustomMark> + 'static) -> Self
orientation(orientation: ChartOrientation) -> Self
x_axis_side(side: AxisSide) -> Self
axis_side(axis: impl Into<SharedString>, side: AxisSide) -> Result<Self, DataError>
state(state: impl HasPhase) -> Self
hidden(ids: impl IntoIterator<Item = impl Into<SharedString>>) -> Self
hovered(point: Option<ChartSelection>) -> Self
selected(point: Option<ChartSelection>) -> Self
emphasized(series: Option<impl Into<SharedString>>) -> Self
tooltip(mode: TooltipMode) -> Self
tooltip_content(build: impl Fn(&ChartTooltipData, &mut Window, &mut App) -> gpui::AnyElement + 'static) -> Self
floating_tooltip(visible: bool) -> Self
range(range: CartesianRange) -> Self
references(references: impl IntoIterator<Item = ChartReference>) -> Self
stale(reason: impl Into<SharedString>) -> Self
height(height: f32) -> Self
format_ticks(format: impl Fn(&str, f64) -> SharedString + 'static) -> Self
x_ticks(ticks: impl IntoIterator<Item = ChartTick>) -> Result<Self, TickError>
axis_ticks(axis: impl Into<SharedString>, ticks: impl IntoIterator<Item = ChartTick>) -> Result<Self, TickError>
on_event(handler: impl Fn(CartesianEvent, &mut Window, &mut App) + 'static) -> Self
Example · cartesian
fn cartesian(_window: &mut Window, cx: &mut App) -> AnyElement {
    let theme = cx.theme().clone();
    let scale =
        |domain| NumericScale::new(ScaleKind::Linear, domain).expect("finite fixture domain");
    let axis = |id: &str, label: &str, domain| ValueAxis {
        id: id.to_string().into(),
        label: label.to_string().into(),
        scale: scale(domain),
    };
    let points = |values: &[Option<f64>]| {
        [
            ("intake", 0.),
            ("validation", 1.),
            ("routing", 2.),
            ("processing", 3.),
            ("delivery", 4.),
        ]
        .into_iter()
        .zip(values)
        .map(|((id, x), y)| RawPoint::new(id, ChartValue::Number(x), *y))
        .collect::<Vec<_>>()
    };
    let mixed = CartesianChart::new(
        "scene.cartesian.mixed",
        "Mixed units · error intervals",
        ChartScale::Numeric(scale([-0.5, 4.5])),
        [
            axis("count", "Requests", [-20., 80.]),
            axis("latency", "Latency (ms)", [0., 400.]),
        ],
    )
    .x_ticks(
        [
            (0., "Intake"),
            (1., "Validate"),
            (2., "Route"),
            (3., "Process"),
            (4., "Deliver"),
        ]
        .into_iter()
        .map(|(value, label)| ChartTick {
            value: ChartValue::Number(value),
            label: label.into(),
        }),
    )
    .expect("caller process ticks in domain")
    .series([
        RawSeries::new("requests", "count", SeriesMark::Bar).points(points(&[
            Some(31.),
            Some(-12.),
            Some(64.),
            Some(48.),
            Some(23.),
        ])),
        RawSeries::new("latency", "latency", SeriesMark::Line)
            .curve(Curve::Monotone)
            .points(points(&[
                Some(80.),
                Some(230.),
                Some(160.),
                Some(310.),
                Some(280.),
            ])),
        RawSeries::new("observed", "count", SeriesMark::Scatter).points([RawPoint::new(
            "audit",
            ChartValue::Number(2.2),
            Some(55.),
        )
        .error([44., 69.])
        .text("Audit", "55 verified")]),
    ])
    .references([ChartReference {
        id: "capacity".into(),
        axis: "count".into(),
        range: [60., 70.],
        label: "Capacity band".into(),
        color: None,
    }])
    .height(180.)
    .selected(Some(ChartSelection::new("observed", "audit")))
    .tooltip(TooltipMode::Point);
    let categories = CategoryScale::new(["West district", "East district", "North district"])
        .expect("distinct fixture categories");
    let categorical =
        |id: &str, values: [f64; 3], percent| {
            RawSeries::new(id, "amount", SeriesMark::Bar)
                .stack(if percent {
                    Stack::Percent("group".into())
                } else {
                    Stack::Absolute("group".into())
                })
                .points(categories.categories().iter().zip(values).map(|(x, y)| {
                    RawPoint::new(x.clone(), ChartValue::Category(x.clone()), Some(y))
                }))
        };
    let stacks = CartesianChart::new(
        "scene.cartesian.stacks",
        "Diverging stacks · independent sign totals",
        ChartScale::Category(categories.clone()),
        [axis("amount", "Amount", [-50., 100.])],
    )
    .series([
        categorical("First", [37., -23., 52.], false),
        categorical("Second", [21., -17., 33.], false),
    ])
    .height(180.);
    let gaps = CartesianChart::new(
        "scene.cartesian.gaps",
        "Missing is not zero · retained stale data",
        ChartScale::Numeric(scale([0., 4.])),
        [axis("value", "Reading", [-10., 50.])],
    )
    .series([
        RawSeries::new("area", "value", SeriesMark::Area)
            .curve(Curve::StepAfter)
            .points(points(&[Some(12.), Some(36.), None, Some(-6.), Some(21.)])),
        RawSeries::new("line", "value", SeriesMark::Line)
            .curve(Curve::StepBefore)
            .points(points(&[Some(5.), Some(20.), None, Some(13.), Some(30.)])),
    ])
    .stale("Fixture refresh refused")
    .height(150.);
    let percent = CartesianChart::new(
        "scene.cartesian.percent",
        "Percent stacks · exact raw readout",
        ChartScale::Category(categories.clone()),
        [axis("amount", "Share (%)", [-100., 100.])],
    )
    .series([
        categorical("First", [37., -23., 52.], true),
        categorical("Second", [21., -17., 33.], true),
    ])
    .height(180.)
    .selected(Some(ChartSelection::new("First", "East district")))
    .tooltip(TooltipMode::SharedAxis);
    stack(&theme).w(px(920.)).child(caption(&theme,"Original fixtures · raw f64 data; shared coordinates, category identity and exact readouts"))
        .child(div().row().items_start().gap_token(&theme,Space::Lg).child(div().flex_1().min_w_0().child(mixed)).child(div().flex_1().min_w_0().child(stacks)))
        .child(div().row().items_start().gap_token(&theme,Space::Lg).child(div().flex_1().min_w_0().child(gaps)).child(div().flex_1().min_w_0().child(percent)))
        .into_any_element()
}